5 Rules for a Successful Campaign

We all do campaigns from time to time, some might be successful and some might feel like waste of resources. Question is, how to get most out of every campaign we run?

To answer this question, we need to study our current customer base. What make them use our service/product? More importantly, what problem are we solving?
It must be main focus, if you have no idea what your customers are looking for, then stop right now and use services like SurveyMonkey to ask this question from your customers. Make them engage with your survey by offering something of value once they fill up the survey form.

Once you know your customer base, now it’s time to analyze your campaign source. Is your campaign targeting your existing customers? Then you already know what they are looking for. Go ahead and get most of your result by offering them a new feature, discount or something they all are looking for.

Are you targeting new customers? Then you must go back and see what problem are you solving for your current loyal customers. New customers will most likely have those problems and you’ll be able to help them. Put focus on what you can solve for them.
Make it look big result yet easy to achieve. Make them want to try your product and see if it work for them.

Now, where to run this campaign? If you are targeting your current visitors, then of course, you can run campaign in a frame in your website or use services such as MailChimp to blast email to them (make sure they agree to receive promotional emails, nobody likes spam)

If you are going to tagger target new customers, where is better than Facebook ads?
You might say Google AdWords, but that depends on your competitor. Try your keywords in Google AdWords and see how much is price of your keywords to be appear in homepage.
If that’s very expensive, just forget about Google AdWords. Competition is very high and you’ll lose more than you earn. You might try Microsoft ads system as an alternative where there are less competitors and take it as your advantage.

But Facebook ensure that your ads will be seen, commented or shared among users, thus you’ll get more exposure. Make sure your target correct audience. Try to guess which interests are more likely to attracts your specified audience. Try to narrow down your audience, so that you get more quality exposure. You don’t want people who like vintage gadgets to see your high end product ads!
Try to run few ads and see which text attract more customers.

You’ll need a SEO optimized landing page to bring those users in. It must be as attractive as your homepage, and it must have very clear call to action button. Make sure keywords the is main problem for your users which you are solving, are bold and repeated over.
These way you get some chance to earn organic free clicks from Google and beat all those competitors who are paying expensive funds for their ads.

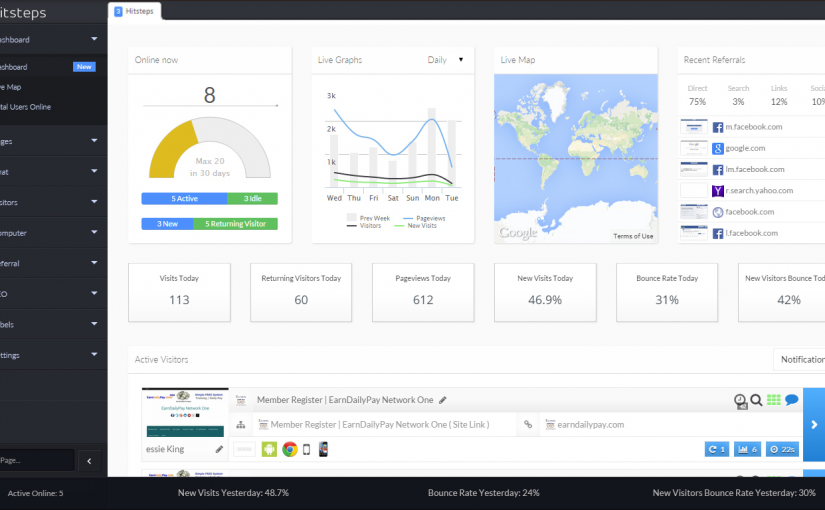
Lastly, you’ll need to track this incoming and existing visitors. You never can guess why your visitors are not converting unless you track their behavior and see in which step, visitors are dropping. Hitsteps offer real-time web analytics dashboard so that you can watch them as they switch pages, as well as campaign tracking so the you can see how many entered your landing page and went as far as registration page, as far as add to cart page and so on. Just sign up for your free account and put tracking code in each of your pages.

Now you are fully equipped for a campaign success. Run your ads, monitor your audience and pages where visitors are dropping, optimize those weak area, keep changing your ads until you get best outcome and lastly, don’t forget about interacting with comments people leave in your Facebook ads and posts.

Google Chrome is still leader in browsers war

It was not long ago when all of us web developers were screaming and pulling out our hairs over Internet Explorer!

Those days are gone! According to latest updates, Internet Explorer share on browser usage is falling more and more each month. It’s only Advantage is being built in into Windows computers. New version of Internet Explorer 10, is not a bad browser at all, but it’s name still remind us of those sleepless nights trying to fix that small yet big problem in Internet Explorer. We hope that Microsoft’s new browser, Spartan Browser, can come into market as a brand new and bugless browser.

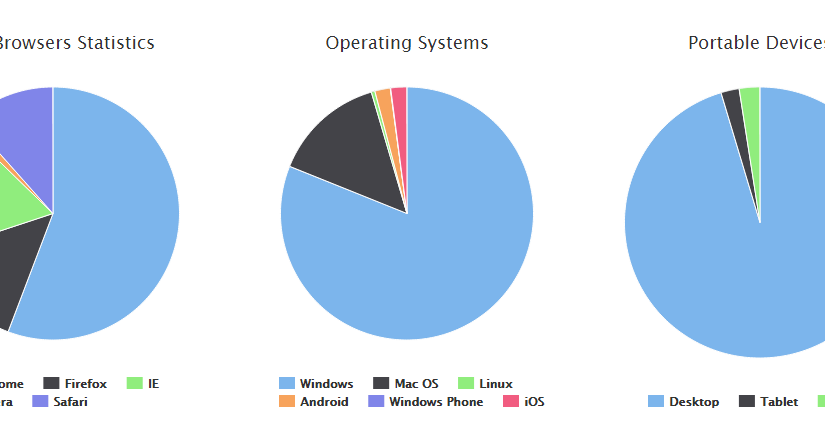
According to Hitsteps Analytics, Google chrome is now leader in Browsers war owning more than half of the market. Firefox, Safari and Internet Explorer have an equal usage rate which is slightly less than Google Chrome. Google Chrome being fast and updated regularly with latest HTML5 and CSS3 technologies, make it popular among users and developers. We hope Spartan browser don’t fall short in this war.

It is very sad to see Opera browser still couldn’t gain any popularity. Recently, Opera ditched it’s own Presto engine in favor of Webkit (used by Google Chrome and Safari) to be able concentrate more on GUI and other aspects of browsers, however, this decision didn’t improve any of it’s ranks in browsers war.

Hitsteps analytics monitor type of devices such as Desktop, Tablet and Mobile phone, therefor we can give following statistics about users device. as you can see, Desktop have biggest rate among our users.

Will Google Chrome stay leader in browsers war? It’s likely to stay leader and we hope so.

2015-01-12_12-11-11

Why Website Analytics Tools Show Different Numbers

Open two analytics dashboards for the same website and you will rarely see identical visitor, session, or pageview totals. That does not automatically mean one tool is broken. In most cases, the tools are measuring different events, applying different rules, or receiving different portions of the traffic.

The useful question is not “Which dashboard has the biggest number?” It is “What does each number include, exclude, and call a visitor?” Once you compare those definitions, most discrepancies become explainable.

The short answer: analytics tools do not observe the same reality

A browser analytics tag records activity only when its code loads and is permitted to send data. A server log records requests that reach the server, including many bots and asset requests. A commerce platform may count activity through first-party store events. A privacy-focused configuration may intentionally collect less data than another setup.

Even two browser-based analytics tools can disagree because they use different session timeouts, bot filters, consent behavior, identity rules, time zones, attribution logic, and processing windows.

Measurement source What it usually sees Why its total can differ
Browser analytics Pageviews and events sent after JavaScript loads Consent, blockers, script errors, navigation timing, and tag configuration
Server logs Requests reaching the web server Bots, monitoring services, cached pages, assets, retries, and prefetching
Commerce or CMS analytics First-party platform sessions, orders, and customer events Platform-specific definitions, bot filtering, consent rules, and time windows
Advertising platforms Ad clicks and attributed conversions Attribution windows, cross-device modeling, duplicate clicks, and consent

1. Consent and tracking prevention remove different visits

If a visitor declines analytics consent, a correctly configured analytics tag may not store or send the same data it would after consent. Browser privacy controls, content blockers, DNS filters, corporate networks, and security extensions can also prevent one vendor’s script while allowing another.

This creates a normal pattern: the website server still receives the page request, but one or more analytics dashboards never receive the corresponding browser event. Google’s own consent documentation notes that denied analytics consent can stop its tag from tracking that activity.

Do not “fix” this difference by bypassing a visitor’s choice. Instead, document how each tool behaves before and after consent and compare like with like.

2. The tracking code may load too late—or more than once

A visitor can leave before a delayed analytics script finishes loading. A strict Content Security Policy can block the script or its collection endpoint. A JavaScript error can stop later code. Single-page applications may change routes without producing a traditional full-page load unless virtual pageviews are configured.

The opposite problem also happens: the same analytics tag is installed through both a plugin and a tag manager, causing duplicate pageviews or events. This is common after a redesign, CMS migration, or plugin change.

Use the website visitor tracking verification guide to confirm that one intended tag loads on every public page and that route changes are counted correctly.

3. “User,” “visitor,” “session,” and “pageview” are not interchangeable

A person can create multiple sessions. Multiple people can use one browser. One person can use several devices. A browser can delete or restrict the identifier that previously connected visits. Logged-in identity can sometimes join activity that browser-only tracking would keep separate.

Session rules differ as well. Google Analytics, for example, documents a default session timeout after 30 minutes of inactivity. Another service can use a different inactivity window or a different rule for when a visit starts and ends.

Before comparing totals, make sure both reports use the same metric:

  • Pageviews: how many tracked page displays or virtual page events occurred.
  • Sessions or visits: groups of activity separated by a timeout or another session boundary.
  • Users or visitors: identifiers believed to represent distinct browsers, devices, accounts, or people.
  • Active or engaged users: visitors who meet a product-specific activity threshold.

4. Bots, monitoring, previews, and internal traffic change the baseline

Search crawlers, uptime monitors, link preview services, security scanners, performance tests, feed readers, and malicious bots all request pages. Server logs usually see them. Analytics products may filter some, classify some, or count some as ordinary visits.

No bot filter is perfect. New automation appears constantly, and legitimate browsers can resemble bots when privacy tools remove identifying signals. Internal staff, developers, QA services, and agency previews can also inflate traffic unless they are filtered consistently.

When a discrepancy begins suddenly, compare user agents, locations, landing pages, referrers, engagement, and request frequency. The existing guide to analytics bot and spam filtering explains the problem in more detail.

5. Time zones and date boundaries split the same visit differently

A report using UTC will not match a report using the store, server, or account time zone around midnight. “Today” can represent different hours in each system. Daylight-saving changes, recently edited account settings, and delayed processing create additional differences.

For a fair comparison, use the same start and end timestamps—not only the same date label—and avoid the newest hours if one platform is still processing them.

6. Attribution rules change where the visit is credited

The total number of visits may be close while channel totals disagree. One tool might preserve the previous campaign, another might credit the most recent referrer, and a commerce platform might use its own attribution window for an order.

Redirects, payment gateways, cross-domain checkout, missing UTM parameters, stripped referrers, and privacy restrictions can all turn a known source into “direct,” “unassigned,” or another channel. Compare the visitor’s landing URL and raw campaign parameters before comparing grouped channel names.

7. Processing, thresholds, modeling, and sampling alter reports

Some reports update immediately; others are recalculated or completed later. Google documents expected differences between reporting surfaces because of filters, retention, thresholds, behavioral modeling, and processing time. It also documents sampling in some high-volume queries.

A live visitor feed and a finalized acquisition report therefore answer different questions. Use real-time visitor tracking to investigate current activity, then use finalized historical reports for longer-term trends.

Real-time visitor analytics dashboard with live activity and historical charts
Live visitor activity and aggregated reports should be compared according to their measurement rules, not expected to be identical.

How to compare two analytics tools correctly

  1. Choose one small time window. Start with a quiet hour or a single day that has finished processing.
  2. Match the time zone. Convert both reports to the same actual start and end timestamps.
  3. Compare the same metric. Pageviews with pageviews, sessions with sessions, and users with users.
  4. Check consent behavior. Test accepted, denied, and unset consent states where applicable.
  5. Verify tag placement. Confirm one copy of each intended tag loads on every relevant page and route.
  6. Separate humans from automation. Review bots, monitors, previews, staff traffic, and performance tests.
  7. Inspect raw journeys. Compare a few individual visits, landing pages, sources, and events before judging the totals.
  8. Wait for final processing. Recheck recent data after the documented processing window.

Which analytics number is correct?

There is rarely one universal number independent of definitions. The most useful number is the one produced consistently for the decision you are making.

Use commerce records for completed orders, server monitoring for server availability, advertising reports for platform attribution, and visitor-level analytics for understanding the page-by-page journey. If you need aggregate acquisition reporting and individual live visitor context, use the tools together and define the role of each.

For a focused comparison of those workflows, see the Hitsteps Google Analytics alternative guide.

Analytics discrepancy checklist

When numbers diverge, record the difference instead of guessing:

  • Tools and exact report names
  • Metric definitions
  • Time zone and precise date range
  • Consent state and blocker tests
  • Tag placement and duplicate-tag check
  • Bot and internal-traffic rules
  • Session timeout and identity method
  • Attribution window and campaign parameters
  • Processing, thresholding, modeling, or sampling notices

A repeatable checklist turns “the dashboards disagree” into a testable measurement problem—and usually reveals exactly where the totals separated.

Further reading: Google Analytics session definitions, reporting-surface differences, and data sampling.

Hitsteps now offer free licenses

Big news, We are excited to announce Hitsteps is available for free now!

Your account is eligible to use free license if your website don’t have much of page views.
1,000 page views per month allowance is good for blogger, photographers and newly developed websites.
What are you waiting for? Get your free plugin at http://wordpress.org/plugins/hitsteps-visitor-manager/ for WordPress or http://extensions.joomla.org/extensions/extension/site-management/analytics/hitsteps-visitor-manager for Joomla

View hitsteps feature in our website: www.hitsteps.com/features.php

Google will review “Not Provided” withholding keywords

Google has been moved to secure search in October 2011 and slowly it applied to more and more users. It was a shocking news to publishers to see some of the keywords are hidden. Now, Google have hidden almost 95% of the keywords to protect users privacy, but it is time that Google reexamine this issue. Google is now looking for a better solution.

Amit Singhal, Google search chief mentioned in a conversation that:

Over a period of time, we [Google’s search and ad sides] have been looking at this issue…. we’re also hearing from our users that they would want their searches to be secure … it’s really important to the users. We really like the way things have gone on the organic side of search.

I have nothing to announce right now, but in the coming weeks and months as [we] find the right solution, expect something to come out.

It is the video for this conversation:

Say Hi to Hitsteps!

Welcome to the next generation of visitor manager and web analytics web app which allow web masters and business owners to get closer to their visitors and understand them more. In next few weeks, service will be completely built and it will be up and running. You might consider testing the service now as well. Stay tuned!