Hitsteps Web Analytics Blog

DNS Load Balancing vs. Failover: What Multiple A Records Actually Do

Reviewed and substantially updated in August 2026.

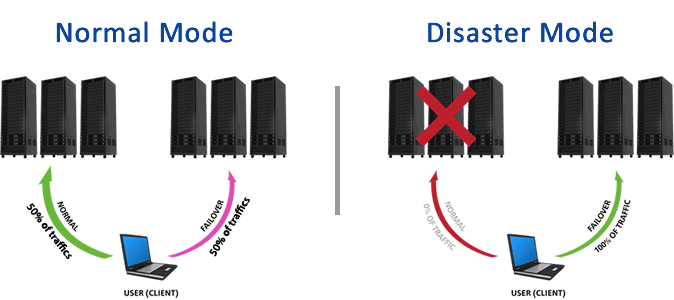
Multiple A or AAAA records can spread DNS answers across servers, but they are not automatically a failover system. Load balancing decides how traffic is distributed; failover detects an unhealthy destination and stops sending it new traffic. A resilient design may do both, but the mechanisms and guarantees must be explicit.

DNS load balancing versus failover

ApproachPrimary purposeHealth awarenessImportant limitation
Several A/AAAA records (round robin)Return multiple origin addressesUsually none in plain DNSResolvers and clients may continue using a failed address
Health-checked DNS steeringChange DNS answers according to health or policyConfigured probesCached answers remain until resolvers/clients refresh them
Reverse proxy or load balancerChoose an origin for each connection/requestUsually active and passive checksThe proxy layer and shared dependencies must also be resilient
CDN/edge load balancingRoute at a distributed edgeProvider-specific monitors and steeringRequires correct origin, state, security, and recovery design

What happens with multiple A records

A DNS name can publish several IPv4 A records or IPv6 AAAA records. Authoritative DNS may rotate their order, and recursive resolvers can cache the set. The operating system or application then decides which address to try and whether to retry another one.

This can distribute some new connections, but it does not guarantee an even split. Recursive resolvers aggregate many users, caches have different lifetimes, clients use different address-selection and retry behavior, and long-lived connections do not consult DNS again until they reconnect.

Most importantly, plain round-robin records do not prove that an origin is healthy. If a server is down or its application is returning errors, its address can remain in the cached answer. Some clients may retry another address; others may show an error or wait for a timeout. Do not describe multiple records alone as seamless automatic failover.

TTL helps, but does not eliminate cache delay

The DNS time to live (TTL) tells caches how long an answer may be reused. A lower TTL can make future changes visible sooner, but it does not revoke answers that are already cached. Resolvers can also impose their own minimums, applications may cache independently, and existing connections are unaffected.

Choose TTL as an operational trade-off, not a promise. Very low values increase query volume and still cannot provide request-by-request routing. Before a planned migration, reduce TTL far enough in advance for the old value to expire, then restore an appropriate value after the change is stable.

When round-robin DNS can still be useful

Multiple records can be reasonable when every destination is independently safe to receive traffic, the application tolerates client-side retry behavior, and occasional uneven distribution is acceptable. It can also expose several edge or service addresses where another layer handles failures.

It is a poor fit when a failed address must disappear quickly, requests modify tightly coupled state, users need sticky sessions, origins have unequal capacity, or the application cannot tolerate timeouts during retry.

What health-checked failover adds

A health-aware service probes each origin and changes routing when defined failure thresholds are met. The check should represent readiness to serve traffic, not merely that a machine responds to ping. Define protocol, path, expected status/body, timeout, interval, and the number of consecutive failures and successes.

Health-checked DNS still has propagation and caching behavior. A reverse proxy, application load balancer, or CDN edge can generally make a decision for a new connection or request without waiting for the user’s cached DNS answer to change.

Cloudflare-specific behavior

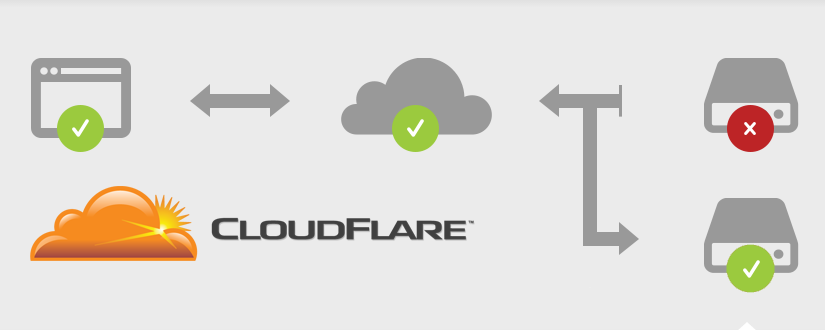
Cloudflare’s round-robin DNS documentation distinguishes unproxied multi-record DNS from proxied behavior. With DNS-only records, multiple addresses are returned and client behavior matters. With proxied records, users connect to Cloudflare; Cloudflare documents Zero-Downtime Failover for eligible proxied multi-origin records. For configurable health monitors, pools, steering, and automatic failover, Cloudflare provides its paid Load Balancing product.

If that is your platform, use the current Cloudflare automatic IP failover setup guide. Do not use legacy API-v1 scripts or expose a Global API Key.

Prepare the origins before distributing traffic

  • Application versions: deploy compatible code and configuration to every origin.
  • Database writes: choose an architecture with defined consistency and conflict behavior. Do not adopt multi-primary replication merely to make a diagram symmetrical.
  • Sessions: use a shared store, stateless signed sessions, or intentional affinity. Local in-memory sessions do not follow a user to another server.
  • Uploads and files: use shared/object storage or reliable replication, and test read-after-write behavior.
  • Queues and scheduled work: prevent duplicate processing and ensure work survives the loss of one origin.
  • TLS and hostnames: every route must validate and serve the intended name correctly.
  • Security: restrict origin access where appropriate, protect health endpoints, and use least-privilege credentials.
  • Capacity: the surviving route must handle the load it will inherit.

A safe test plan

  1. Map the path from authoritative DNS through resolver/cache, edge or load balancer, origin, session store, database, and third-party dependencies.
  2. Record normal answers and origin health from more than one external network.
  3. Test the dedicated health endpoint and a small set of critical user journeys.
  4. During a maintenance window, withdraw or disable one origin at the routing layer instead of unexpectedly crashing a production server.
  5. Measure detection, cached-answer behavior, new and existing sessions, errors, writes, queue processing, and recovery.
  6. Restore the origin, confirm consecutive healthy results, and watch for flapping or data reconciliation problems.
  7. Document rollback steps and the person authorized to execute them.

Monitor from outside the routing system

A provider’s health probe tells that provider what it can reach. An independent check tells you more about the path a user sees and can reveal a provider-wide, DNS, certificate, or configuration failure. Hitsteps uptime monitoring can serve as one external availability signal; it does not replace application, infrastructure, database, or security monitoring.

Bottom line

Use multiple DNS records when all returned addresses are safe and simple distribution is sufficient. Use health-checked routing when failed destinations must be removed automatically. Use a proxy, load balancer, or edge service when decisions need to happen faster than DNS caches refresh. In every case, resilient routing only works when sessions, data, files, capacity, TLS, health checks, monitoring, and rollback have been designed and tested together.

Cloudflare Automatic IP Failover: A Current, Safer Setup Guide

Reviewed and substantially updated in August 2026.

The old API-v1 script previously published on this page is obsolete and should not be used. Current Cloudflare automatic failover is built around Load Balancing: health monitors check origins, origins are grouped into pools, and a load balancer routes traffic according to health and steering policy.

This guide explains the current design, the prerequisites people often miss, and how to test a failure without turning a maintenance exercise into an outage.

What Cloudflare automatic IP failover does

Cloudflare Load Balancing is a paid add-on that can distribute traffic across origins and steer away from an unhealthy pool. Its core objects are:

  • Monitor: the request Cloudflare sends and the conditions that count as healthy.
  • Origin: an address and port serving the application.
  • Pool: one or more origins, usually representing a location or failure domain.
  • Load balancer: the hostname, pools, fallback pool, and steering policy presented to users.

This is different from simply publishing several A records. Plain round-robin DNS distributes answers but does not necessarily perform active health checks or promptly stop returning a failed origin. See DNS load balancing versus health-checked failover for the architecture trade-offs.

Before you configure failover

A second server is not automatically a safe failover target. Confirm these items first:

  • Application parity: both origins run compatible code, configuration, dependencies, and scheduled jobs.
  • Data consistency: decide how database writes, uploaded files, queues, and caches remain correct during and after a switch.
  • Session behavior: use a shared session store, stateless sessions, or intentional session affinity. Do not assume an in-memory session exists on another server.
  • TLS and host handling: each origin accepts the expected hostname and has the correct origin certificate/configuration.
  • Network access: firewalls allow Cloudflare health probes and proxied traffic without unnecessarily exposing an administrative service.
  • Capacity: the remaining healthy pool can handle the full expected load.
  • Recovery ownership: an operator knows how to diagnose the failed origin and return it safely.

Design a useful health endpoint

A monitor should test the minimum path that proves the origin can serve real traffic. A TCP connection alone says that a port is open; it does not prove the application can answer correctly. Conversely, a check that depends on every downstream integration may cause unnecessary failover when a non-essential service has a brief problem.

A dedicated endpoint such as /healthz can return a small response with an expected status code and body. Consider whether it should verify:

  • the web process is responsive;
  • essential configuration is loaded;
  • a critical database dependency is available;
  • the application is ready to receive traffic rather than merely started.

Keep the response free of secrets and sensitive diagnostics. Protect the endpoint from expensive work, make its result deterministic, and document exactly what “healthy” means.

Configure failover in the Cloudflare dashboard

  1. Create the monitor. Choose protocol, port, path, method, expected status, optional expected body, timeout, interval, and consecutive success/failure thresholds. Cloudflare’s monitor documentation describes the available settings.
  2. Create a primary pool. Add the primary origin or origins and attach the monitor.
  3. Create a secondary pool. Put it in a genuinely separate failure domain where practical, then attach the same monitor or an intentionally different one.
  4. Choose the fallback pool. This is used if other pools are unavailable according to the configured logic, so it must be able to serve the application safely.
  5. Create the load balancer. Select the public hostname, default pool order, fallback pool, TTL/steering options, and any session-affinity behavior your application requires.
  6. Observe health before sending production traffic. Confirm every origin reports the expected state and investigate any flapping.

Cloudflare documents pool composition and health behavior in its Load Balancing pools guide. Names and dashboard placement can change; use the current documentation rather than copying an old screenshot or API call.

If you automate it, use scoped API tokens

Prefer the dashboard for a one-off setup. If infrastructure automation is necessary, use the current Cloudflare API and a narrowly scoped API token. Do not paste a Global API Key into a shell script, source repository, ticket, or monitoring URL. Store secrets in the deployment platform’s secret manager, limit permissions to the required zone/account resources, rotate credentials, and keep an audit trail.

Make automation idempotent: reading the current configuration and applying a defined desired state is safer than a script that blindly swaps addresses. Include validation and a rollback path.

Test the design before relying on it

  1. Record the normal pool and origin health state.
  2. Send a distinctive test request and confirm which origin serves it without exposing that marker to ordinary users.
  3. During a maintenance window, disable the primary origin in Cloudflare or make the dedicated test endpoint fail in a controlled way. Avoid crashing a production host merely to prove routing.
  4. Measure detection time, traffic transition, errors, session continuity, queued work, and user-visible behavior.
  5. Restore the primary, wait for consecutive successful checks, and confirm recovery does not cause a second disruption.
  6. Write down the evidence and adjust thresholds if normal latency causes false failures.

Also test a partial failure: an application can return HTTP 200 while logins, checkout, uploads, or database writes are broken. Synthetic checks for critical user journeys may be needed in addition to the routing health endpoint.

Monitoring and failover are separate responsibilities

Cloudflare’s monitor informs Cloudflare’s routing decision. An independent external monitor helps confirm what a user can reach and can alert an operator if all routes fail or the DNS/CDN layer itself is affected. Hitsteps uptime monitoring can be one external availability signal; analytics traffic is not a health check and should never control failover.

Keep alerts actionable: include the hostname, affected pool/origin, failing condition, start time, runbook, and owner. Avoid putting API tokens or sensitive health-response details in an alert URL.

Rollback plan

Before launch, export or document the prior DNS and Load Balancing configuration. Define who can:

  • disable a failing origin;
  • restore the previous pool order or hostname record;
  • freeze writes if data consistency is uncertain;
  • verify recovery from outside Cloudflare;
  • reconcile sessions, queues, uploads, and database changes after the event.

Automatic routing reduces time spent sending users to a known unhealthy origin. It does not solve state replication, software defects, capacity shortfalls, or a dependency shared by every pool. Treat failover as one tested layer in a broader recovery plan.

How fast are SSD servers? Performance comparison between HDD vs SSD

SSD make difference!

We’ve been hearing that SSD hard disks are new generation and therefor, all database intensive servers have to move to new SSD servers. We gave it a shot and we never regret it!

In hitsteps, we analyze thousands of hits per seconds. this hits then categorized and processed by a background processor, and archived somewhere along with millions of other hits!

Given searching a visitor or looking back into archive of a visitor is an essential feature of hitsteps, we always had to struggle with performance of database searches, specially when searching for some visitors who visited months ago.

MySQL databases need RAM to hold all indexes of data, they also need a fast disk in case data are not in RAM. so we did the test in a mirrored server:

Our search parameter was a simple query of “Searching for a visitor for who visited hitsteps dashboard who are from Canada since 6 months ago”

HDD server took 45 seconds to return query (almost near to timeout in most apache web server setups). SSD server took only 6 seconds to return query. Going to page number 2 in HDD took 15 seconds, in SSD just a wee 2 seconds.

It worth mentioning all other simple queries take less than 0.2 seconds in SSD servers and 0.5 in HDD servers.

Please do note that this times are closed source and relative to our script and codes. It might be different with other Applications, codes and scripts you might use in your server. RAM also play a major role here which is more appearance if your server is using HDD.

Nous parlons francais!

Bonjour!

It’s been a while we are working on this one, french language is hard to learn, and we now realized, it is also hard to translate! Took us 1 month and half to finally get language ready all over hitsteps, but it come just on time for this new year, we welcome 2016 with a new language!

If you are a french user and you have selected french as your language during signup, hitsteps now automatically show french language to you,

New users will be detected by their geolocation and correct language will be set for them, so everything goes smooth and automatic.

If you would like to get back to english language, you can do so by using language switcher at footer of our homepage.

There are lot of languages out there, but it take very long time to translate for each of them, therefor we will plan a community driven system where everybody can collaborate their own language and shape hitsteps for their own, wait for that!

How Visitor Profile unifying works in Hitsteps Web Analytics?

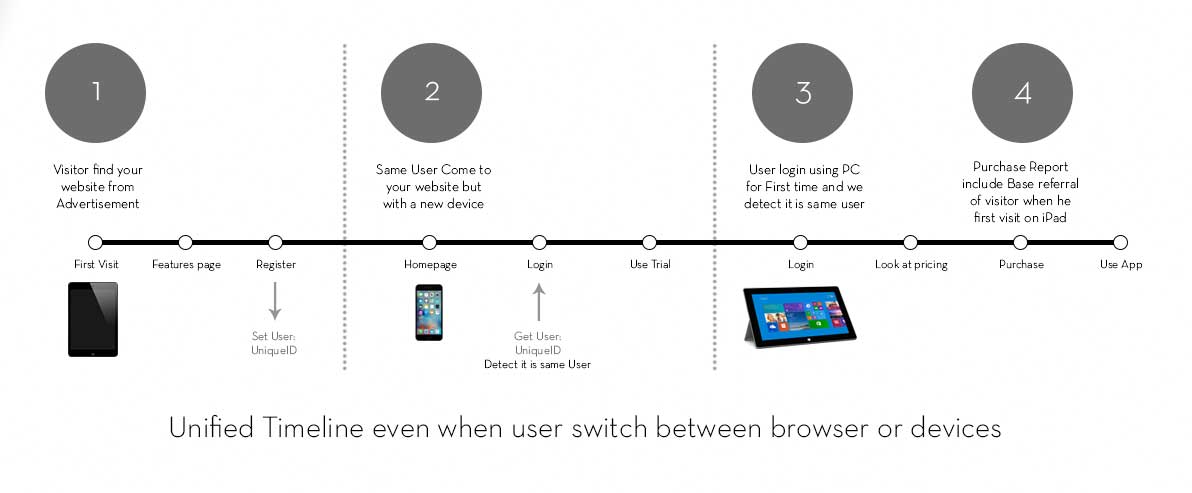
We are happy to announce a new feature, called “Cross-Device” or “Visitor Merging”, you get the idea.

You can see full customer journey in your website. So your users can access your services on their phones, tablets and desktop. Hitsteps now will keep all of their different devices profile in one unique profile, making it easy for you to keep track of each particular users.

Basically, what it do is to assign an Unique ID to your visitors (say their email) once they leave a comment or once they login.

Next time same user come to your website, even with another device, mobile or tablet, once they login back, Hitsteps will detect their previous profile and merge them together. so that new session will be continue of user’s previous session. be 1 day before or 1 month before.

You can register your hitsteps account now and give it a try. If you use wordpress, be sure to use our WordPress plugin to automatically integrate this feature.

It comes handy when your users register on your website from mobile device, then few days later continue their browsing from a Desktop and purchase something from you. If profiles were to kept separated, you look at profile who purchases from you and you have no idea how this visitor even find your website! Worry no more!

Our WordPress users can update their WordPress plugin to v4.81 now and benefit from this feature on their WordPress based website (WooCommerce and such)

Unified visitor sessions

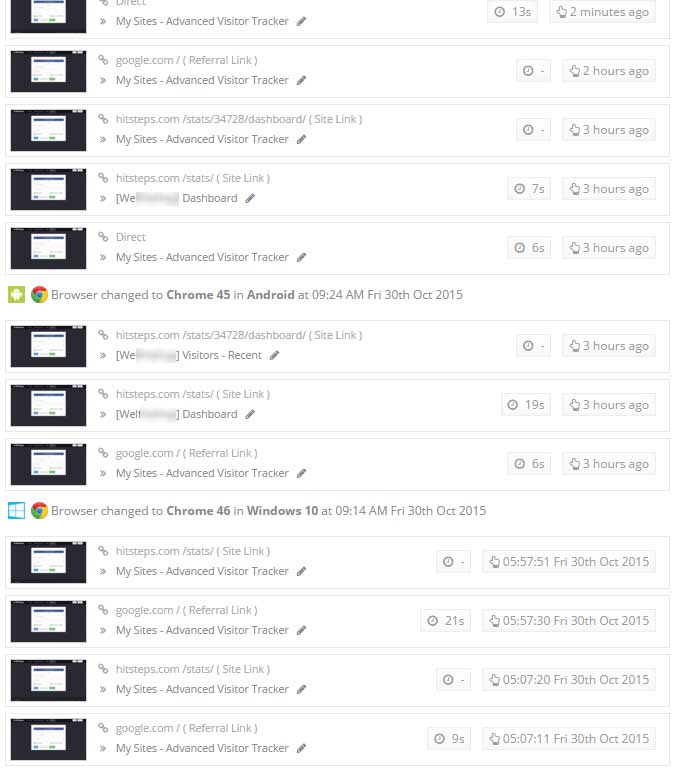
Here is how it looks like in your visitor profile reporting:

visitor profile timeline

Our other users will need a little bit of coding.

Just put following code above hitstep’s tracking script, you need to define a unique ID using server-side scripting, and we will take care of rest:

<script>
_hs_uniqueid=”YOUR_DEFINED_UNIQUE_ID”;
</script>

so that you can define a unique ID for each user, say their email address or their User ID and have it linked to visitor who is browsing your website.

While you are there, don’t forget you can set a name for your visitor using ipname parameter as well:

<script>
ipname=”YOUR_VISITOR_NAME”;
</script>

Once a user login and If we have user’s unique ID stored before, All events he fired and pages he viewed perior to login, will be linked to main profile ID by Hitsteps Analytics and make a unified timeline of full user behaviour.

Easy way to Track visitors on Shopify Store

Since we have launched Hitsteps Shopify App last week, we have applied many minor changes to perfect it.

It is a deal breaker for your business and make you be able to understand your visitors in deeper depth.

Here is how to install Histeps Web Analytics on your Shopify:

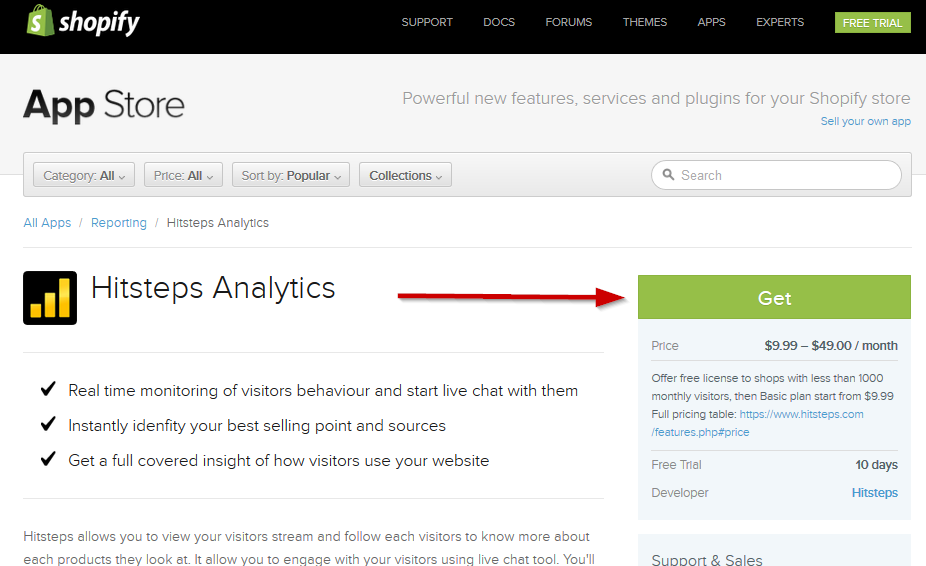
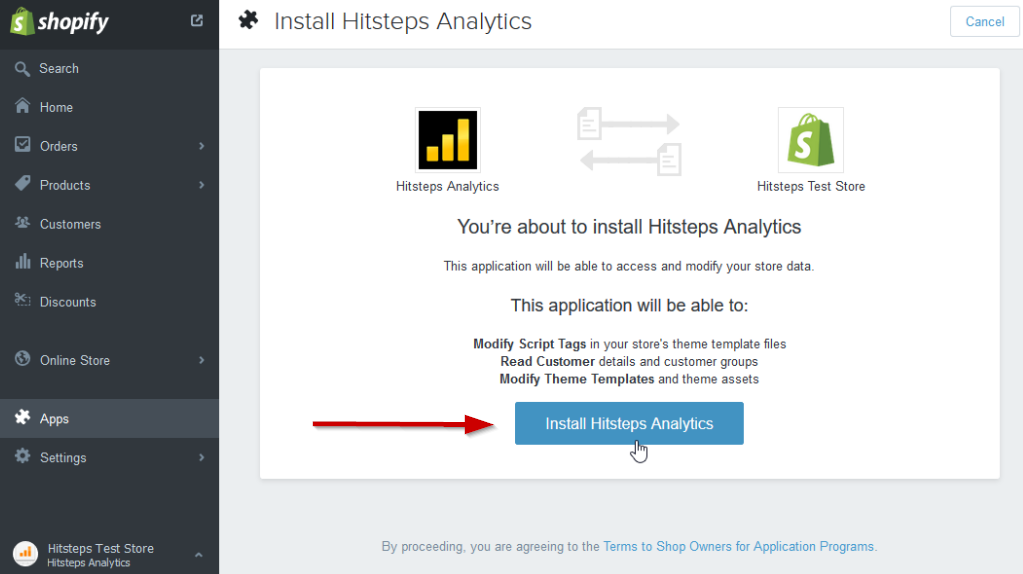
  1. Open Hitsteps App in Shopify here.
  2. Click on Get to get the app for your store.-2015-10-23_20-43-54
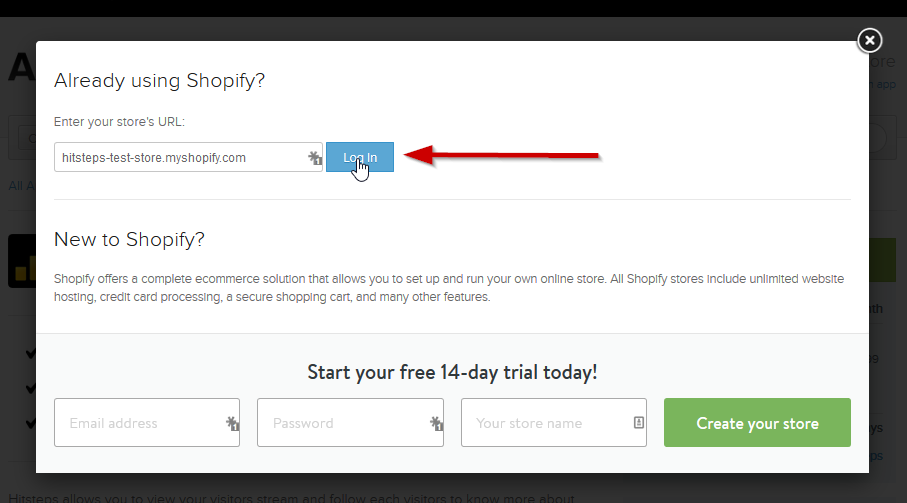
  3. If Shopify Asked you to enter your shop info, enter it. Otherwise go to next step.2015-10-23_20-44-15
  4. Shopify need to ask for Install confirmation. Please Install hitsteps shopify analytics.
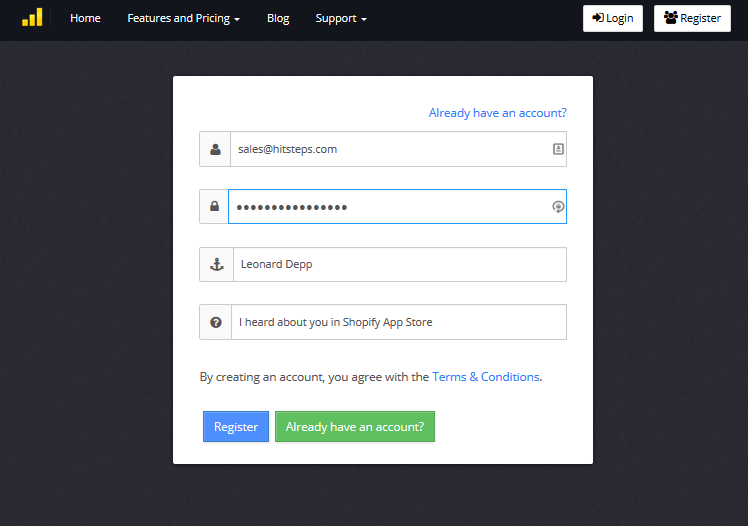
  5. You’ll need to create your Hitsteps account (or login if you already have an account in hitsteps) Just fill up the form.2015-10-23_20-41-43
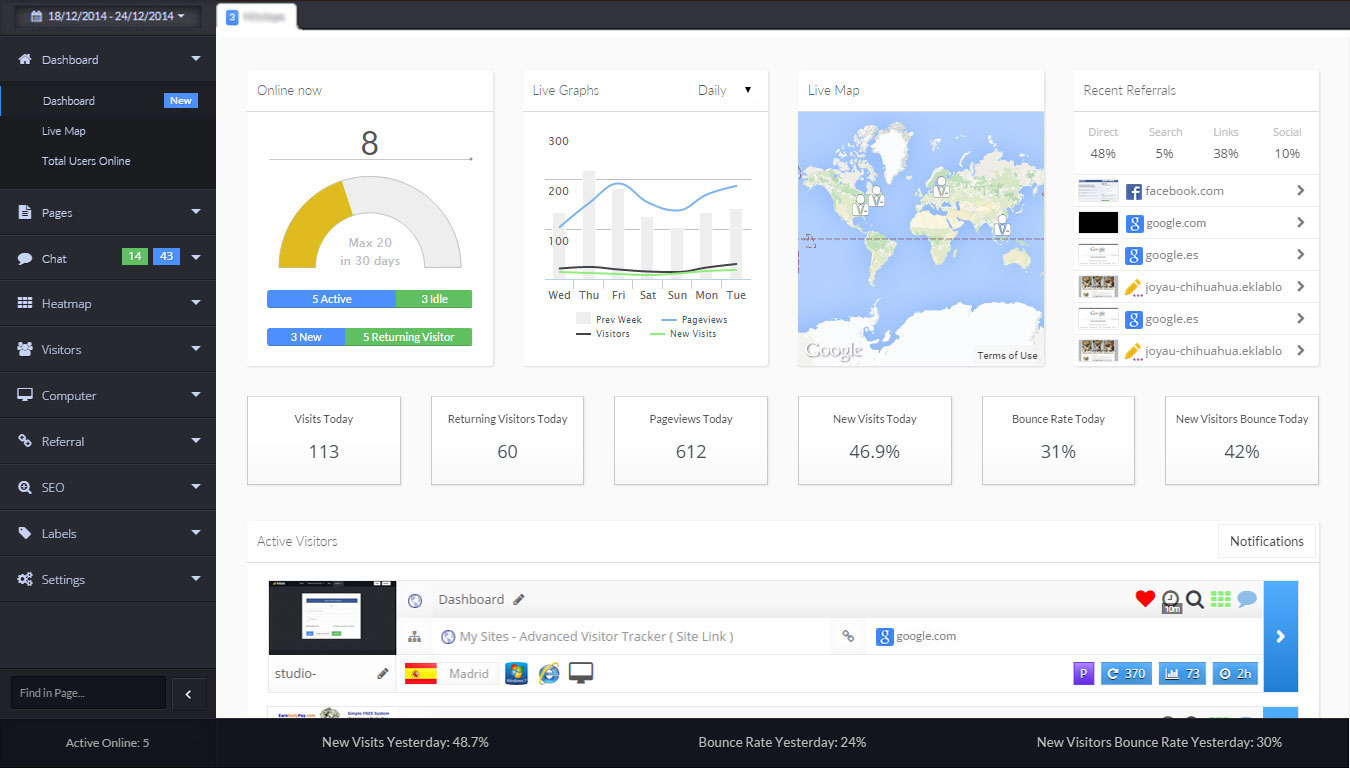
  6. Enjoy looking at flow of your visitors in your newly created hitsteps analytics dashboard.dashboardl

How to install Hitsteps Web Analytics in Shopify

hitsteps love shopify

We are proud to announce hitsteps full integration with Shopify ecommerce and online shop service.

If you have a shopify shop, don’t worry about changing themes and inject hitsteps code. Simply install hitsteps app from the Shopify App Store.

The app will automatically install, add your website to hitsteps, create predefined shopify labels for you to track sales and products, and automatically install hitsteps code on all pages of your Shopify Store.


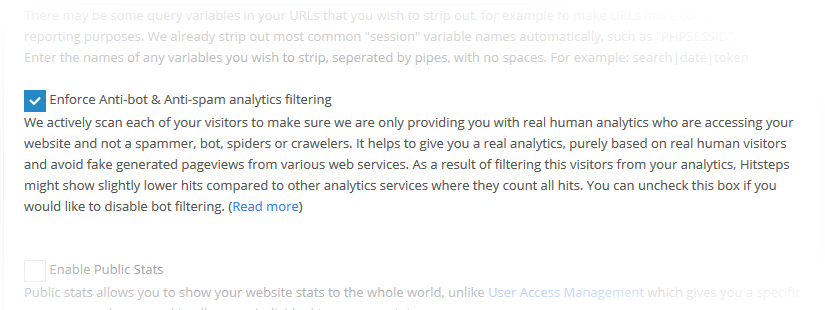
Enforce Anti-bot & Anti-spam analytics filtering

Today we have a real deal for you, for those of you who are tired of getting excited by a high peak on your traffic only to know that it’s been a Microsoft Bingbot, Google bot, Facebook crawler or any other bot crawling around in your website.

We had a basic bot filtering in place since our launch last year, but now we have tighten this system.

Now we actively scan each one of your visitors to make sure we are only providing you with real human analytics who are accessing your website.

It helps to give you a real analytics insight, purely based on real human visitors and avoid fake generated pageviews from various web services.

For example, if somebody share your page on facebook, facebook will open your website to take a snapshot for thumbnail photos. this process will repeat for each new shares. Normally you might think you are getting lot of visitors, but in fact they are all Facebook thumbnail generator bots trying to open your website and get list of photos to show them upon sharing. It give you false hope and screw your analytics data. We have eliminated it!

As a result of filtering this visitors from your analytics, Hitsteps might show slightly lower hits compared to other analytics services where they count all hits. It come to our attention that many many analytics still track visitors like in ancient days and ignoring the fact that nowadays, many web services have a tool to scan your website and thus, they show you not so useful analytics insight.

If you were still unsure about hitsteps analytics, but now you made up your mind, go ahead! We will meet you inside. Get Hitsteps WordPress plugin.

Percentage values in Email report and Dashboard pages

We have decided to change the way we shown percentage values in hitsteps.

You most probably seen that first item ( e.g. in popular pages section ) is always 100%. Reason behind it was that we calculate percentage value relative to highest hit. We did this back in our private beta times when our customers wanted more contrast between each value.

After some internal discussion and our customers feedbacks, we have decided to change percentage values to be relative to total hits, as a result, represent a better picture of each row.

This change has been applied to your email report and dashboard as of today.

Continue reading Percentage values in Email report and Dashboard pages

Referral Spammers, no more!

If you looked at your analytics data recently and looked at your referral section, probably you have noticed some strange referrals from websites that you cannot identify why they should send you visitors!

email-gateway-anti-spam

We are strictly against spam and automated bots in hitsteps and we are against this method of referral spamming too. as you know, your analytics number and list of online users only reflect your true human visitors and you won’t see bots, spammers and spiders in your web statistics.

These services are not actually sending you real traffic! we have analyzed all traffics coming from them for all of our customers and we noticed a bounce rate of 100%, it means all visitors come through them close website as soon as it is loaded. this is highly unlikely scenario from human-line browsing.

so why they do this? They are actually advertising to you. this way, they can show their name to you in your statistics report. so you get curious and follow up to see who are they and visit their website! so this way they increase their visibility not only in hitsteps, all other analytics such as google analytics, piwik and … too, as they show them as your top referral once they have send enough (useless and bounced!) traffic to you.

We don’t know how they send this traffic to you, but we assure you this traffics are spam and therefore their name in your referral section is spam as well, as a result we have took necessary action to protect our users from spam statistics and continue to provide real human web analytics.

Starting from today, this referrals won’t show up as your online visitor, won’t count as a pageview and won’t show up in your referrals in hitsteps.

If you are only using hitsteps, then you are protected!