How to read a heatmap
A heatmap is easy to look at and easy to misread. Four steps keep you honest: check how many visits built the map, find the hot and cold areas, separate the pattern from the noise, then change one thing and read the map again.
- Read the visit count before the colors
- One page, one change, then re-read
- Free plan, paid plans from $4.99 a month
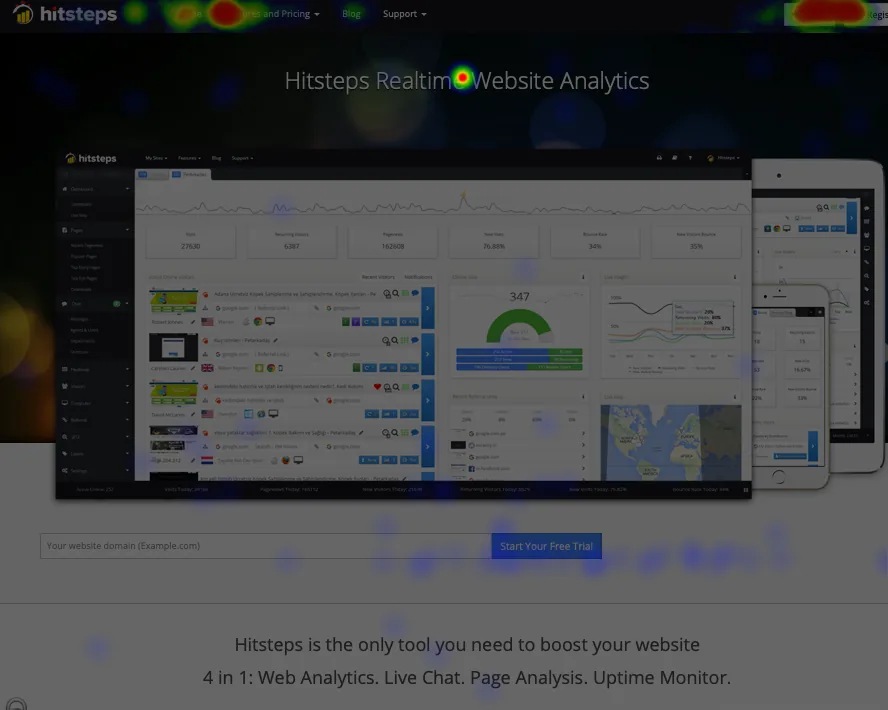
What a heatmap actually shows
A heatmap takes the clicks on one page and colors the page by where they landed. Warm bands mean many clicks, cold areas mean almost none. That is the whole picture: a record of clicks, not of thoughts.
Two things follow from that. First, the map is only as good as the visits behind it, so the number matters more than the colors. Second, a map answers "where", never "why". The why comes from the traffic on that page: which sources brought the visits, and what those visitors did next.
Hot areas
Buttons, links and images that get pressed often. A hot call to action means people found it. A hot piece of plain text usually means they expected it to be clickable.
Cold areas
Parts nobody touches. A cold button below the fold is common. A cold button that sits in the middle of a busy section is the finding worth acting on.
Read a heatmap in four steps
- 1. Check the visit count. Look at how many visits built this map and on which page. Under a hundred visits on one page, treat everything as a hint.
- 2. Find the hot spots and the dead zones. Note the two or three warmest areas and any important element that stayed cold. Ignore everything in between for now.
- 3. Separate pattern from noise. A pattern that repeats across two weeks, or across mobile and desktop separately, is real. A single warm pixel from Tuesday is not.
- 4. Change one thing and re-read. Move the button, rewrite the label, shorten the form. Then wait for fresh visits and open the same map again.
If a warm area needs context, open the visitor feed and look at the visits that reached that page: their first referrer and path are usually enough to explain the color. Click heatmaps are included from the Growth plan upward, and the free plan covers 1 site with 2,000 pageviews a month.
Four common misreads
Too few visits
A map of twelve visits looks exactly like a map of two thousand, only quieter. Always check the count before you quote the picture.
Mobile and desktop mixed
A button that is hot on desktop can be invisible on a phone. Split the map by device before you conclude that everyone found it.
Heat is not always good
People clicking text that does nothing, or pressing a disabled control, shows up as a hot spot too. Heat measures attention, not success.
Reading it daily
Two days of traffic will not change a map. Re-read weekly on pages you are changing, and leave the rest alone.
Read the map, then open the visit
In Hitsteps the click heatmap sits in the same workspace as the visitor feed, which lists every visit with its page path, source and journey, and each visit row carries a heatmap icon that opens the map for the page that visit reached. The heatmap tool page shows what the map includes and what it deliberately does not claim.
Reading a heatmap: common questions
What does a heatmap actually show?
A click heatmap colors each part of a page by how often visitors clicked there. Warm areas get many clicks, cold areas get few. It describes what happened on that page, not why it happened, so read it with the visitor feed beside it.
How many visits do I need before a heatmap is reliable?
Treat a map from fewer than a hundred visits on one page as a hint. A few hundred visits start to repeat the same pattern, and a pattern that survives two weeks of traffic is the one worth acting on.
Why is the top of the page always the hottest?
Because that is where visitors arrive and decide. Above the fold gets the first click and most of the scrolling stops there. A hot top area is normal; the interesting question is what happens below it.
How often should I re-read a heatmap?
Every week or two on the pages you are changing. Read the map, make one change, wait for fresh visits, and read it again. Maps read daily mostly show you the same noise twice.
Read your own pages with Hitsteps
Install the tracking code, open the heatmap on your busiest page, and follow the four steps above.
7-day Pro trial. No card needed. Click heatmaps are on the Growth plan and above.
Sources and further reading
- Reading routine follows our own click heatmap guide, which shows what a map adds to pageview counts.
- Plan facts from our pricing page: free plan, 1 site, 2,000 pageviews a month; paid plans from $4.99 a month; click heatmaps from Growth; 7-day Pro trial without a credit card.
- Comparing tools? See the best website heatmap software in 2026.