Ignored calls to action
Check whether the buttons and links that matter most receive attention, or whether visitors overlook them.
A website heatmap tool shows where visitors click on a page, so you can see what gets attention and what gets ignored.
Hitsteps click heatmap software turns tracked page clicks into a visual website click map. Warmer areas mark more activity. Cooler areas mark less. Pair that with page analysis and visitor context so design changes follow evidence, not guesswork.
Hitsteps helps you see where visitors come from and what they do next: traffic sources and journeys in the same workspace as heatmap analytics.
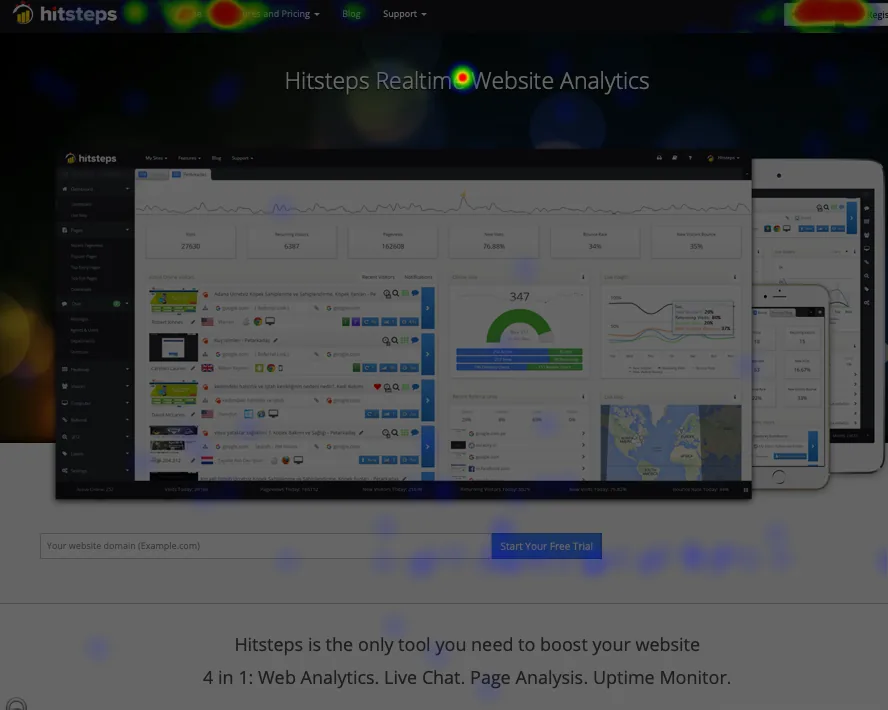
A page can look clear to the team that built it while sending different signals to a first-time visitor. A website click map makes those signals visible.
Check whether the buttons and links that matter most receive attention, or whether visitors overlook them.
Spot images, headings, or decorative elements that attract clicks even when they are not interactive.
See which menu items and page links visitors choose, then compare that with the journey you intended.
Measure which product cards, plan details, comparison links, and checkout actions attract the most clicks.
Review page behavior alongside device and browser reports when a layout appears to work for one audience but not another.
Use observed click patterns to choose one focused design change, then measure whether the new version improves the intended action.
Hitsteps pairs visual heatmaps with page analysis: aggregated click insight tied to HTML elements on the tracked page.
Page analysis helps you find which banners, buttons, and links get the clicks you expect, and which ones do not. It tracks clicks on Ajax dynamic content, hidden elements such as in-page popups and sub-menus, and carousels or slider banners.
Together, click map software and page analysis answer these questions:
| Question | What you use |
|---|---|
| Where do clicks cluster on the page? | Click heatmaps (visual map) |
| Which page elements get or miss clicks? | Page analysis (element-level aggregates) |
| Who produced that pattern, and what happened next? | Real-time visitor tracking, sources, paths, Goals, Segments |
A click map shows what happened on the page. To understand who produced that pattern and what happened before and after, use real-time visitor tracking for live visits, sources, paths, and returning context in the same workspace.
Real-time visitor trackingA useful heatmap review begins with a question and ends with a measured change.
Start with a landing page, pricing page, product page, article, or form. Ask something specific, such as whether visitors notice the primary action.
Let the page receive enough normal traffic to show a pattern. Avoid making an important decision from a handful of internal or unusual visits.
Check whether the strongest visual elements receive the expected interaction and whether secondary elements distract from the main goal.
Look at sources, devices, browsers, entry pages, exits, Goals, and visitor paths before assuming the page design is the only cause.
Move or rewrite a call to action, simplify navigation, remove a misleading cue, or improve the page hierarchy. Keep the change focused enough to evaluate.
A hotter button is not automatically a better outcome. Confirm that the revised clicks also support the goal, conversion, lead, purchase, or support action you care about.
Check whether the message, proof, and primary call to action guide paid or campaign traffic toward the intended next step.
See which plan details, comparisons, feature explanations, and signup actions attract serious consideration.
Identify which benefits and proof elements receive attention and whether visitors click non-interactive images expecting more detail.
Learn which related links, examples, navigation choices, and next-step prompts help readers continue instead of exiting.
| Capability | Hitsteps scope | How to use it |
|---|---|---|
| Click heatmaps | Visual analysis of recorded page clicks and popular or overlooked areas. | Evaluate calls to action, navigation, page elements, and interaction hierarchy. |
| Page analysis | Click insight connected to the tracked page and broader analytics reports. | Combine the visual pattern with page traffic, entry and exit behavior, and visitor journeys. |
| Visitor context | Real-time visits, profiles, sources, devices, locations, paths, Segment matches, and Goals in the same product. | Investigate which audiences and journeys may be shaping the observed clicks. |
| Not claimed here | Session replay, scroll maps, mouse maps, rage clicks, or automatic experimentation. | If you need session replay, a dedicated replay tool covers that. But replay alone will not show you where each visitor came from, or let you chat with them. Hitsteps keeps heatmaps next to the live visitor and their journey. |
Heatmaps use the same Hitsteps tracking installation for most pages. They need enough traffic before the report is useful. Heatmaps are available on Growth and above (Growth+). Free and Starter do not include heatmap click collection. Daily click limits and heatmap archive length vary by plan. For current allowances, see features and pricing.
Create a site in Hitsteps and copy the tracking code or choose an integration.
Use a direct JavaScript tag or a setup path for WordPress, Shopify, Wix, Google Tag Manager, Joomla, Drupal, or another supported platform. Install once. Do not combine a plugin, manual snippet, and GTM for the same site.
Open your site and confirm the visit in the live dashboard.
On Growth+ or during an eligible Pro trial, connect findings to sources, journeys, Goals, and Segments.
A click heatmap shows the parts of a tracked page that receive more or fewer clicks. It helps reveal whether visitors interact with important buttons, links, images, navigation, and other page elements.
There is no single minimum for every site. A small sample can expose obvious click patterns. Higher stakes design decisions should use enough representative traffic to avoid reacting to a few unusual visits.
This page describes Hitsteps click heatmaps and page analysis. It does not claim session replay, scroll maps, rage clicks, or mouse maps. Session replay is not generally available.
Yes. Hitsteps combines heatmap and page analysis with live visitor tracking, traffic sources, page paths, visitor profiles, Goals, Segments, and live chat context in the same analytics workspace.
Heatmaps start on Growth and above (Growth ). Free and Starter include core analytics without heatmaps. Compare current daily click and archive limits at /features.php#price.
Create a Hitsteps site and install its tracking code directly or through a supported platform integration. Once heatmap access is active on your plan, tracked page clicks can be reviewed from the page and heatmap reports.
Start with Hitsteps, verify your traffic, and connect heatmap analytics to the visitor and campaign context behind them.