Traffic and audience
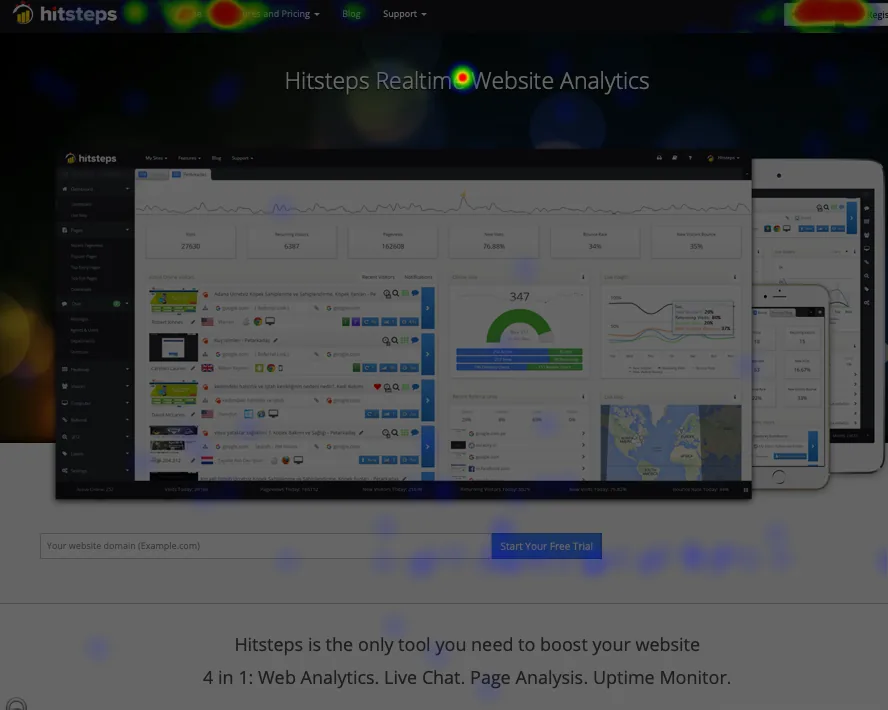
Review pageviews, visits, new visitors, bounce rate, daily trends, traffic sources, countries, search, and technology reports.
Connect Hitsteps to Grafana through the Infinity data source and use an importable dashboard for traffic, live visitors, content, sources, Segments, Funnels, and more.

The ready-made dashboard uses the Hitsteps aggregate endpoint through Infinity. Change the Grafana time range, refresh the panels, and keep Hitsteps analytics beside the operational dashboards your team already monitors.
Review pageviews, visits, new visitors, bounce rate, daily trends, traffic sources, countries, search, and technology reports.
Keep current visitor totals, top pages, entry and exit pages, referrers, downloads, outbound links, videos, and goals in one dashboard.
Measure aggregate Segment matches, funnel starts, completions, conversion rates, and stage progression without returning visitor identities.
Create the data source once, keep the API key in Grafana’s protected authentication setting, and then import the dashboard JSON. Grafana data access is available on Business and higher plans; active trials can use it until the trial expires.
In Grafana Cloud, Infinity is available. In self-managed Grafana, install Grafana’s Infinity data source plugin and restart Grafana if requested.
Open Connections or Configuration, choose Data sources, click Add new data source, and select Infinity. Name the data source Hitsteps.
Open the Authentication tab, select Bearer Token, and enter your Hitsteps API key into the Bearer token field.
Bearer Token → your Hitsteps API keyIn Allowed hosts, enter the Hitsteps website URL so Grafana permits requests to the connector.
https://www.hitsteps.com/Save the data source and use Grafana’s Save & test action. The protected token should stay in the data source and never be placed in a panel URL.
Open Dashboards, choose Import, upload the Hitsteps dashboard JSON, and select the Hitsteps Infinity data source when Grafana asks you to map it.
The dashboard JSON contains panel definitions and endpoint URLs, but no API key. Keep the key in Grafana’s secure Bearer Token field, limit access to the data source, and use HTTPS for all requests. Hitsteps returns bounded aggregate data and does not return visitor identities, individual Segment matches, or Funnel events through this connector.
Download the maintained dashboard JSON and connect it to the Hitsteps data source you just created.
No. Use Grafana's Infinity data source. Hitsteps provides the authenticated JSON endpoint and the ready-made dashboard; no custom Grafana plugin installation is required.
Put the key in the Infinity data source Authentication tab as a Bearer Token. The dashboard JSON does not contain an API key, so you can import and share the dashboard without exposing the credential.
The dashboard covers aggregate Hitsteps traffic trends, live visitors, sources, pages, audience and technology reports, search, downloads, outbound links, videos, goals, Segments, Funnels, and Funnel stages.
Download the dashboard JSON from this page, open Dashboards then Import in Grafana, upload the file, and select the Hitsteps Infinity data source when Grafana asks you to map the data source.
Use it when you need live visitor context, practical installation routes, and action tools around the traffic you already have.
Hitsteps has kept evolving across website platforms, browser changes, analytics shifts, and store workflows.
WordPress, Shopify, Wix, Google Tag Manager, HTML, CMS, commerce, browser, and desktop setup paths are documented from one hub.
Live dashboard, visitor profiles, heatmaps, chat, Segments, uptime, reports, and alerts stay connected after tracking is installed.