Επισκεψιμότητα και κοινό
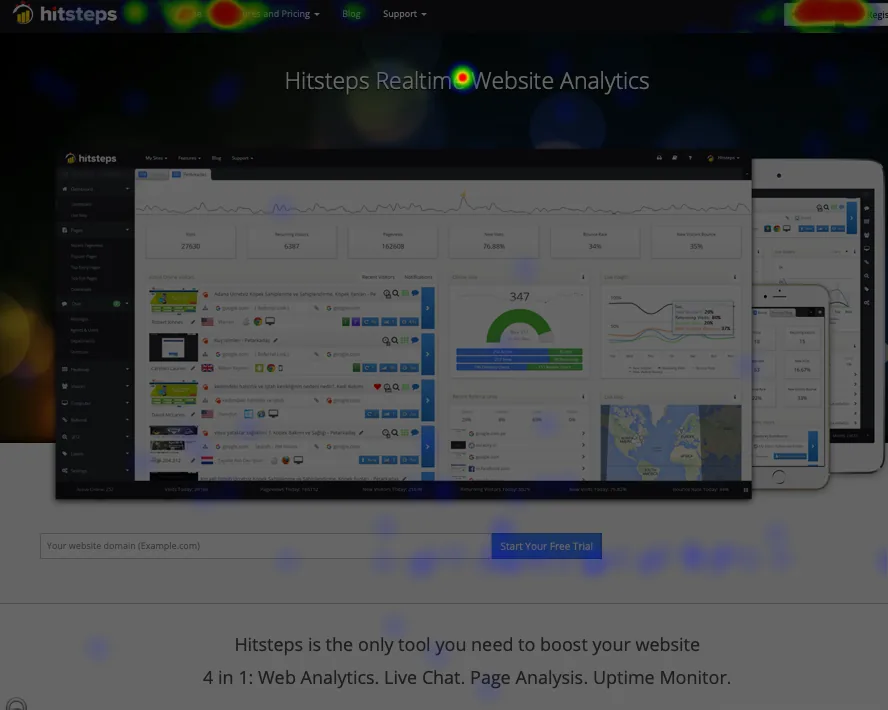
Εξετάστε προβολές σελίδων, επισκέψεις, νέους επισκέπτες, ποσοστό εγκατάλειψης, ημερήσιες τάσεις, πηγές επισκεψιμότητας, χώρες, αναζητήσεις και αναφορές τεχνολογίας.
Συνδέστε το Hitsteps με το Grafana μέσω της πηγής δεδομένων Infinity και χρησιμοποιήστε έναν εισαγώγιμο πίνακα ελέγχου για επισκεψιμότητα, ζωντανούς επισκέπτες, περιεχόμενο, πηγές, Τμήματα, Χωνιά και άλλα.

Ο έτοιμος πίνακας ελέγχου χρησιμοποιεί το συγκεντρωτικό τελικό σημείο του Hitsteps μέσω του Infinity. Αλλάξτε το χρονικό εύρος στο Grafana, ανανεώστε τα πάνελ και κρατήστε τις αναλύσεις του Hitsteps δίπλα στους λειτουργικούς πίνακες ελέγχου που ήδη παρακολουθεί η ομάδα σας.
Εξετάστε προβολές σελίδων, επισκέψεις, νέους επισκέπτες, ποσοστό εγκατάλειψης, ημερήσιες τάσεις, πηγές επισκεψιμότητας, χώρες, αναζητήσεις και αναφορές τεχνολογίας.
Συγκεντρώστε σε έναν πίνακα ελέγχου τα τρέχοντα σύνολα επισκεπτών, τις κορυφαίες σελίδες, τις σελίδες εισόδου και εξόδου, τους παραπέμποντες, τις λήψεις, τους εξερχόμενους συνδέσμους, τα βίντεο και τους στόχους.
Μετρήστε συγκεντρωτικές αντιστοιχίσεις Τμημάτων, εκκινήσεις και ολοκληρώσεις Χωνιών, ποσοστά μετατροπής και πρόοδο σταδίων, χωρίς να επιστρέφονται ταυτότητες επισκεπτών.
Δημιουργήστε την πηγή δεδομένων μία φορά, φυλάξτε το κλειδί API στην προστατευμένη ρύθμιση ελέγχου ταυτότητας του Grafana και, στη συνέχεια, εισαγάγετε το JSON του πίνακα ελέγχου. Η πρόσβαση στα δεδομένα μέσω Grafana είναι διαθέσιμη στα προγράμματα Business και ανώτερα· οι ενεργές δοκιμαστικές περίοδοι μπορούν να τη χρησιμοποιούν μέχρι να λήξουν.
Στο Grafana Cloud, το Infinity είναι διαθέσιμο. Σε αυτοδιαχειριζόμενο Grafana, εγκαταστήστε το πρόσθετο πηγής δεδομένων Infinity του Grafana και επανεκκινήστε το Grafana αν σας ζητηθεί.
Ανοίξτε το Connections ή το Configuration, επιλέξτε Data sources, κάντε κλικ στο Add new data source και επιλέξτε Infinity. Ονομάστε την πηγή δεδομένων Hitsteps.
Ανοίξτε την καρτέλα Authentication, επιλέξτε Bearer Token και εισαγάγετε το κλειδί API του Hitsteps στο πεδίο Bearer token.
Bearer Token → το κλειδί API σας του HitstepsΣτο πεδίο Allowed hosts, εισαγάγετε το URL του ιστοτόπου Hitsteps, ώστε το Grafana να επιτρέπει αιτήματα προς τον connector.
https://www.hitsteps.com/Αποθηκεύστε την πηγή δεδομένων και χρησιμοποιήστε την ενέργεια Save & test του Grafana. Το προστατευμένο token πρέπει να παραμένει στην πηγή δεδομένων και να μην τοποθετείται ποτέ σε URL πάνελ.
Ανοίξτε το Dashboards, επιλέξτε Import, ανεβάστε το JSON του πίνακα ελέγχου Hitsteps και επιλέξτε την πηγή δεδομένων Hitsteps Infinity όταν το Grafana σας ζητήσει να την αντιστοιχίσετε.
Το JSON του πίνακα ελέγχου περιέχει ορισμούς πινάκων και διευθύνσεις URL τελικών σημείων, αλλά όχι κλειδί API. Διατηρήστε το κλειδί στο ασφαλές πεδίο Bearer Token του Grafana, περιορίστε την πρόσβαση στην πηγή δεδομένων και χρησιμοποιήστε HTTPS για όλα τα αιτήματα. Το Hitsteps επιστρέφει περιορισμένα συγκεντρωτικά δεδομένα και δεν επιστρέφει μέσω αυτής της σύνδεσης ταυτότητες επισκεπτών, μεμονωμένες αντιστοιχίσεις Τμημάτων ή συμβάντα Χωνιών.
Κατεβάστε το συντηρούμενο JSON του πίνακα ελέγχου και συνδέστε το με την πηγή δεδομένων Hitsteps που μόλις δημιουργήσατε.
No. Use Grafana's Infinity data source. Hitsteps provides the authenticated JSON endpoint and the ready-made dashboard; no custom Grafana plugin installation is required.
Put the key in the Infinity data source Authentication tab as a Bearer Token. The dashboard JSON does not contain an API key, so you can import and share the dashboard without exposing the credential.
Ο πίνακας ελέγχου καλύπτει συγκεντρωτικές τάσεις επισκεψιμότητας Hitsteps, ζωντανούς επισκέπτες, πηγές, σελίδες, αναφορές κοινού και τεχνολογίας, αναζήτηση, λήψεις, εξερχόμενους συνδέσμους, βίντεο, στόχους, Τμήματα, Χωνιά και στάδια Χωνιών.
Download the dashboard JSON from this page, open Dashboards then Import in Grafana, upload the file, and select the Hitsteps Infinity data source when Grafana asks you to map the data source.
Χρησιμοποιήστε το όταν χρειάζεστε ζωντανό πλαίσιο για τους επισκέπτες, πρακτικούς διαδρομούς εγκατάστασης και εργαλεία δράσης γύρω από την κίνηση που έχετε ήδη.
Hitsteps Πραγματικοί επισκέπτες, πραγματικό πλαίσιο και πιο γρήγορες αποφάσεις.
Τα WordPress, Shopify, Wix, Google Tag Manager, HTML, CMS, το ηλεκτρονικό εμπόριο, τα προγράμματα περιήγησης και οι διαδρομές εγκατάστασης για υπολογιστές τεκμηριώνονται σε ένα κέντρο.
Η ζωντανή κονσόλα, τα προφίλ επισκεπτών, οι θερμικοί χάρτες, η συνομιλία, τα Τμήματα, η διαθεσιμότητα, οι αναφορές και οι ειδοποιήσεις παραμένουν συνδεδεμένα μετά την εγκατάσταση της παρακολούθησης.