Observed load timing
Review page load duration values supplied by compatible browsers during tracked visits rather than relying only on a test machine.
Hitsteps records available page load timing from compatible visitor browsers so you can compare observed performance across pages and visits under real devices, networks, and browsing conditions.
Field timing reflects a mixture of page code, device capability, network quality, cache state, browser support, and third-party resources, so comparisons need context.
Review page load duration values supplied by compatible browsers during tracked visits rather than relying only on a test machine.
Look for tracked pages whose observed timing is consistently slower than other pages or their earlier baseline.
Inspect available device, browser, location, and visitor context when a particular load appears unusually slow or fast.
Use it when you need live visitor context, practical installation routes, and action tools around the traffic you already have.
Hitsteps has kept evolving across website platforms, browser changes, analytics shifts, and store workflows.
WordPress, Shopify, Wix, Google Tag Manager, HTML, CMS, commerce, browser, and desktop setup paths are documented from one hub.
Live dashboard, visitor profiles, heatmaps, chat, Segments, uptime, reports, and alerts stay connected after tracking is installed.

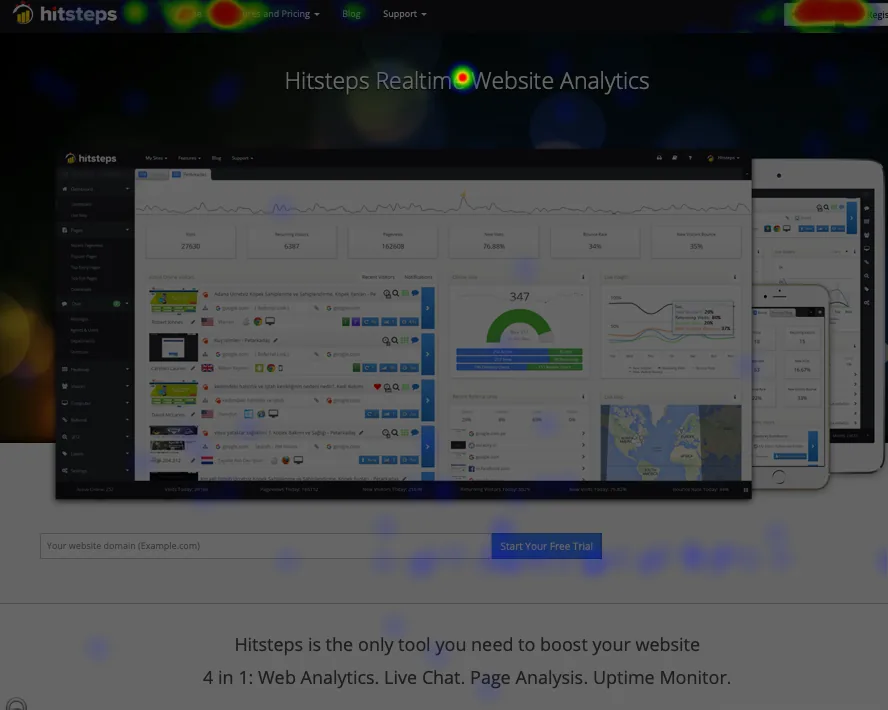

Hitsteps page speed data describes available page load timing from tracked visits. Core Web Vitals use defined metrics, eligibility rules, and aggregation methods that require appropriate dedicated tooling.
Collect enough compatible visits across normal devices and networks before treating a few extreme values as a page-wide issue.
Look for repeat patterns by page, browser, device class, geography, or time period rather than one isolated load.
Use browser developer tools, server monitoring, lab tests, and dedicated Core Web Vitals data to diagnose the cause of a field pattern.
Compare an equivalent visitor mix after optimizing images, scripts, caching, backend work, or third-party resources.
See whether slow observations cluster among particular device classes, browsers, regions, or connection conditions.
Watch for a sustained timing change after deploying a new template, script, media asset, or third-party integration.
Prioritize pages that repeatedly show slower observed loads instead of optimizing every route without evidence.
Clear answers about what this feature reports, how to use it, and where its limits are.
No. Synthetic tools load a page under controlled test conditions. Hitsteps uses available timing from real tracked visits, where devices, networks, cache state, and browsers vary.
This feature should not be presented as a Core Web Vitals report. It records available page load timing for visitor and page analysis; use dedicated field data and diagnostics for Core Web Vitals.
A compatible timing signal may not be available because of browser support, blocked tracking, consent, interrupted navigation, background behavior, or other conditions that prevent the value from reaching Hitsteps.
Connect this report with the surrounding visitor, acquisition, and workflow context.
Create a free account, install the Hitsteps tracking code, and confirm your first visit before choosing the plan that fits your traffic and reporting needs.